Management by Exception and Variance
Analysis:
Variance analysis and performance reports are
important elements of management by exception. Simply put, management by exception means that the manager's attention should be directed
toward those parts of the organization where plans are not working out for
reason or another. Time and effort should not be wasted focusing on those parts
of the organization where things are going smoothly.
The budgets and standards explained in this
section of the web site (See
standard costing and Variance Analysis) reflect management's plans. If all goes according to
plans, there will be little difference between actual results and the results
that would be expected according to the budgets and standards. If this happens,
managers can concentrate on other issues. However, if actual results do not
conform to the budget and to standards, the performance reporting system sends a
signal to the management that an "exception" has occurred. This signal is in the
form of a variance from the budget or standards.
However, are all variances worth investigating?
The answer is no. Differences between actual results and what was expected will
almost always occur. If every variance were investigated, management would waste
a great deal of time tracking down nickel-and-dime differences. Variances may
occur for any of a variety of reasons - only some of which are significant and
warrant management attention. For example, hotter than normal weather in the
summer may result in higher than expected electrical bills for air conditioning.
Or, workers may work slightly faster or slower on a particular day. Because of
unpredictable random factors, one can expect that virtually every cost category
will produce a variance of some kind.
How should managers decide which variances are
worth investigating? One clue is the size of the variance. A variance of $5 is
probably not big enough to warrant attention, whereas a variance of $5000 might
well be worth tracking down. Another clue is the size of the variance relative
to the amount of spending involved. A variance that is only 0.1% of spending on
an item is likely to be well within the bounds one would normally expect due to
random factors. On the other hand, a variance of 10% of spending is much more
likely to be a signal that something is basically wrong.
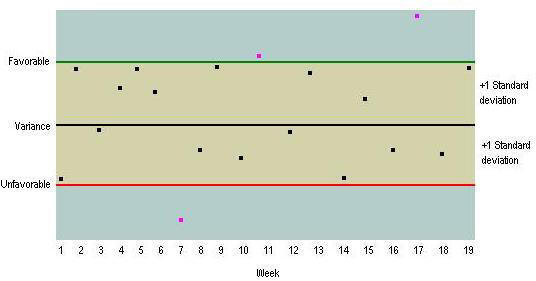
A more dependable approach is to plot variance
data on a statistical control chart, The basic idea underlying a statistical
control chart is that some random fluctuations in variances from period to
period are normal and to be expected even when costs are well under control. A
variance should only be investigated when it is unusual relative to that normal
level of random fluctuation. Typically the standard deviation of the variance is
used as the measure of the normal level of fluctuations. A rule of thumb is
adopted such as "investigate all variances that are more than X standard
deviations from zero." In the control chart in example below, X is 1.0.
That is the rule of thumb in this company is to investigate all variances that
are more than one standard deviation in either direction (favorable or
unfavorable) from zero. This means that the variances in weeks 7, 11, and 17
would have been investigated, but non of others.
What value of X (standard deviation) should
be chosen? The bigger the value of X, the wider the band of acceptable
variances that would not be investigated. Thus the bigger the value of X,
the less time will be spent tracking down variances, but the more likely it
is that a real out of control situation would be overlooked. Ordinarily, if
X is selected to be 1.0, roughly 30% of all variances will trigger an
investigation even when there is no real problem. If X is set at 105, the
figure drops to about 13%. If X is set at 2.0, the figure drops all the way
to about 5%. Don't forget, however, that selecting a big value of X will
result not only in fewer investigations but also a higher probability that a
real problem will be overlooked. In addition to watching for unusually large
variances, the pattern of the variances should be monitored. For example, a
run of steadily mounting variances should trigger an investigation even
though non of the variances is large enough by itself to warrant
investigation.
Relevant Articles:
|