Break-even Point Analysis:
Contents:
-
Definition and Explanation
-
Calculation by equation
method
-
Calculation by
contribution margin method
-
Advantages
-
Limitations
-
Review problem
Break-even point
is the level of sales at which profit is zero. At break even
point total sales are equal to total cost (variable
+ fixed).
If a firm cannot manage sales
to cover variable as well as fixed costs it will have to bear
losses. The following is the further explanation of
this concept:
|
Profit |
|
Sales > Variable Expenses +
Fixed Expenses |
|
|
|
Break-even Point |
|
Sales = Variable Expenses +
Fixed Expenses |
| |
|
Loss |
|
Sales < Variable Expenses +
Fixed Expenses |
|
There are two
methods for the calculation of break-even point.
These are:
- Equation
method
- Contribution
margin method
We can use the
following equation to calculate break-even point:
Profit = Sales - (Variable expenses + Fixed
expenses)
or
Sales = Variable expenses + Fixed expenses + Profit
When break-even
point is calculated using above equation profit is
taken as zero because break-even is that level of
sales where sales are equal to total cost (variable
+ fixed) and profit is zero.
Example:
We can
use the following data to calculate break-even
point.
-
Sales price per unit = $500
-
variable cost per unit = $300
-
Total fixed expenses = $70,000
Required:
Calculate break-even point using equation method.
Solution:
Sales = Variable expenses + Fixed expenses + Profit
$500Q* = $300Q*
+ $70,000 + $0**
$200Q = $70,000
Q =
$70,000/$200
Q =
350 Units
Q*
= Number (Quantity) of units sold.
**The break even point
can be computed by finding that point where profit
is zero
Graphical
Representation (Break-even Chart
- CVP Graph):
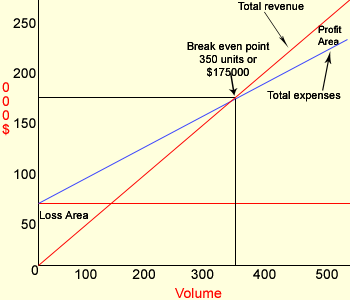
The break even
point in sales dollars can be computed by
multiplying the break even level of unit sales by
the selling price per unit.
350
Units × $500 Per unit = $175,000
Under this method
total fixed cost is divided by unit contribution
margin. The resulting figure is number of units to
be sold to break-even (no profit, no loss).
Example:
We can
use the following data to calculate break-even
point.
-
Sales price per unit = $500
-
variable cost per unit = $300
-
Total fixed expenses = $70,000
Required:
Calculate break-even point using contribution margin
method.
Solution:
Break-even point in units = Fixed expenses / Unit
contribution margin
$70,000 / $200*
350
Units
*$500 (Sales) − $300
(Variable exp.)
Break even point in
sales:
350
Units × $500 Per unit
= $175,000
Equation method and
contribution margin methods are equivalent.
Contribution margin method is actually a shortcut
conversion of equation method.
The following
formula is also extensively used to calculate break
even point:
Break-even Sales in Dollars = [Fixed Cost / 1 –
(Variable Cost / Sales)]
This formula
produces the same answer:
Break Even Point = [$70,000 / 1 – (300 / 500)]
=
$70,000 / 1 – 0.6
=
$70,000 / 0.4
=
$175,000
Number of units to be sold to
break even:
$175,000 / $500
= 350 units
Following are some of the main
advantages of break even analysis:
- It explains the
relationship between cost, production, volume and returns.
- It can be extended to show
how changes in fixed cost, variable cost, commodity prices,
revenues will effect profit levels and break even points.
Break even analysis is most useful when used with partial
budgeting, capital budgeting techniques.
- The major benefits
to use break even analysis is that it indicates the lowest
amount of business activity necessary to prevent losses.
Break even analysis is best
suited to the analysis of one product at a time. It may be
difficult to classify a cost as all variable or all fixed; and
there may be a tendency to continue to use a break even analysis
after the cost and income functions have changed.
Voltar Company
manufactures and sells a telephone answering
machine. The company's contribution format income
statement for the most recent year is given below:
| |
Total |
Per unit |
Percent of
sales |
|
Sales |
$1,200,000 |
$60 |
100% |
|
Less variable
expenses |
900,000 |
45 |
?% |
| |
|
|
|
|
Contribution
margin |
300,000 |
15 |
?% |
|
Less fixed
expenses |
240,000 |
|
|
| |
|
|
|
|
Net operating
income |
$60,000 |
|
|
| |
|
|
|
Required:
Calculate break-even point both in units and sales
dollars. Use the equation method.
Solution:
Sales = Variable expenses + Fixed expenses +Profit
$60Q
= $45Q + $240,000 + $0
$15Q
= $240,000
Q =
$240,000 / 15 per unit
Q =
16,000 units; or at $60 per unit, $960,000
Alternative
solution:
X =
0.75X + 240,000 + $0
0.25X = $240,000
X =
$240,000 / 0.25
X =
$960,000; or at $60 per unit, 16,000 units
Relevant Articles:
|